Chapter 15 Miscellaneous Regression Topics
Chapter Preview. This chapter provides a quick tour of several regression topics that an analyst is likely to encounter in different regression contexts. The goal of this chapter is to introduce these topics, provide definitions and illustrate contexts in which these topics may be applied.
15.1 Mixed Linear Models
Although mixed linear models are an established part of statistical methodology, their use is not as widespread as regression in actuarial and financial applications. Thus, the section introduces this modeling framework, beginning with a widely used special case. After introducing the modeling framework, this section describes estimation of regression coefficients and variance components.
We begin with the one-way random effects model, with model equation \[\begin{equation} y_{it} = \mu + \alpha_i + \varepsilon_{it}, ~~~~~ t=1, \ldots, T_i, ~~ i=1,\ldots, n. \tag{15.1} \end{equation}\] We may use this model to represent repeated observations of subject or group \(i\). The subscript \(t\) is used to denote replications that may be over time or multiple group membership (such as several employees in a firm). Repeated observations over time was the focus of Chapter 10.
When there is only one observation per group so that \(T_i=1\), the disturbance term represents the unobservable information about the dependent variable. With repeated observations, we have an opportunity to capture unobservable characteristics of the group through the term \(\alpha_i\). Here, \(\alpha_i\) is assumed to be a random variable and is known as a random effect. Another approach, introduced in Section 4.3, represented \(\alpha_i\) as a parameter to be estimated using a categorical explanatory variable.
For this model, \(\mu\) represents an overall mean, \(\alpha_i\) the deviation from the mean due to unobserved group characteristics and \(\varepsilon_{it}\) the individual response variation. We assume that \(\{\alpha_i\}\) are i.i.d. with mean zero and variance \(\sigma^2_{\alpha}\). Further assume that \(\{\varepsilon_{it}\}\) are i.i.d. with mean zero and variance \(\sigma^2\) and are independent of \(\alpha_i\).
One extension of equation (15.1) is the basic random effects model described in Section 10.5, based on model equation
\[\begin{equation}\label{E15:BasicRE} y_{it} =\alpha_i + \mathbf{x}_{it}^{\prime} \boldsymbol \beta + \varepsilon_{it}. \tag{15.2} \end{equation}\] In this extension, the overall mean \(\mu\) is replaced by the regression function \(\mathbf{x}_{it}^{\prime} \boldsymbol \beta\). This model includes random effects (\(\alpha_i\)) as well as fixed effects (\(\mathbf{x}_{it}\)). Mixed effects models are ones that include random as well as fixed effects.
Stacking the model equations in an appropriate fashion yields an expression for the mixed linear model \[\begin{equation} \mathbf{y} = \mathbf{Z} \boldsymbol \alpha + \mathbf{X} \boldsymbol \beta +\boldsymbol \varepsilon . \tag{15.3} \end{equation}\] Here, \(\mathbf{y}\) is a \(N \times 1\) vector of dependent variables, \(\boldsymbol \varepsilon\) is a \(N \times 1\) vector of errors, Z and X are \(N \times q\) and \(N \times k\) known matrices of explanatory variables, respectively, and \(\boldsymbol \alpha\) and \(\boldsymbol \beta\) are \(q \times 1\) and \(k \times 1\) vectors of unknown parameters. In the mixed linear model, the \(\boldsymbol \beta\) parameters are fixed (non-stochastic) and the \(\boldsymbol \alpha\) parameters are random (stochastic).
For the mean structure, we assume E(\(\mathbf{y}|\boldsymbol \alpha) = \mathbf{Z} \boldsymbol \alpha + \mathbf{X} \boldsymbol \beta\) and E \(\boldsymbol \alpha = \mathbf{0}\), so that \(\mathrm{E}~\mathbf{y} = \mathbf{X} \boldsymbol \beta\). For the covariance structure, we assume Var(\(\mathbf{y}|\boldsymbol \alpha) = \mathbf{R}\), Var (\(\boldsymbol \alpha)= \mathbf{D}\) and Cov(\(\boldsymbol \alpha,\boldsymbol \varepsilon ^{\prime} )= \mathbf{0}\). This yields Var \(\mathbf{y} = \mathbf{Z D Z}^{\prime} + \mathbf{R = V}\). In longitudinal applications, the matrix \(\mathbf{R}\) is used to model the intra-subject serial correlation.
The mixed linear model is quite general and includes many models as special cases. For a book-length treatment of mixed linear models, see Pinheiro and Bates (2000). To illustrate, we return to the basic random effects model in equation (15.2). Stacking the replications from the \(i\)th group, we may write \[ \mathbf{y}_i = \alpha_i \mathbf{1}_i + \mathbf{X}_i \boldsymbol \beta +\boldsymbol \varepsilon_i, \] where \(\mathbf{y}_i = (y_{i1} , \ldots, y_{iT_i})^{\prime}\) is the vector of dependent variables, \(\boldsymbol \varepsilon_i = ( \varepsilon_{i1} , \ldots, \varepsilon_{iT_i})^{\prime}\) is the corresponding vector of disturbance terms, \(\mathbf{X}_i = (\mathbf{x}_{i1} , \ldots, \mathbf{x}_{iT_i})^{\prime}\) is the \(T_i \times k\) matrix of explanatory variables and \(\mathbf{1}_i\) is a \(T_i \times 1\) vectors of ones. Stacking the groups \(i=1, \ldots, n\) yields equation (15.3) with \(\mathbf{y} = (\mathbf{y}_1^{\prime} , \ldots, \mathbf{y}_n^{\prime})^{\prime}\), \(\boldsymbol \varepsilon = (\boldsymbol \varepsilon_1 ^{\prime}, \ldots, \boldsymbol \varepsilon_n^{\prime})^{\prime}\), \(\boldsymbol \alpha = ( \alpha _1 , \ldots, \alpha _n)^{\prime}\),
\[ \mathbf{X}= \left( \begin{array}{c} \mathbf{X}_1 \\ \vdots \\ \mathbf{X}_n \\ \end{array} \right) ~~~~\mathrm{and}~~~~ \mathbf{Z}= \left( \begin{array}{cccc} \mathbf{1}_1 & \mathbf{0} & \cdots & \mathbf{0}\\ \mathbf{0} & \mathbf{1}_2 & \cdots & \mathbf{0}\\ \vdots & \vdots & \ddots & \vdots \\ \mathbf{0} & \mathbf{0}& \cdots & \mathbf{1}_n\\ \end{array} \right) . \]
Estimation of the mixed linear model proceeds in two stages. In the first stage, we estimate the regression coefficients \(\boldsymbol \beta\), assuming knowledge of the variance-covariance matrix \(\mathbf V\). Then, in the second stage, components of the variance-covariance matrix \(\mathbf V\) are estimated.
15.1.1 Weighted Least Squares
In Section 5.7.3, we introduced the notion of weighted least squares estimates of the regression coefficients of the form \[\begin{equation} \mathbf{b}_{WLS} = \left(\mathbf{X}^{\prime} \mathbf{W}\mathbf{X} \right)^{-1}\mathbf{X}^{\prime} \mathbf{W}\mathbf{y} . \tag{15.4} \end{equation}\] The \(n \times n\) matrix \(\mathbf{W}\) was chosen to be of the form \(\mathbf{W} = diag(w_i)\) so that the \(i\)th diagonal element of \(\mathbf{W}\) is a weight \(w_i\). As introduced in Section 5.7.3, this allowed us to fit heteroscedastic regression models.
More generally, we may allow \(\mathbf{W}\) to be any (symmetric) matrix (such that \(\mathbf{X}^{\prime} \mathbf{W}\mathbf{X}\) is invertible). This extension allows us to accommodate other types of dependencies that appear, for example, in mixed linear models. Assuming only that E \(\mathbf{y} = \mathbf{X} \boldsymbol \beta\) and Var \(\mathbf{y} = \mathbf{V}\), it is easy to establish \[\begin{equation} \mathrm{E}~\mathbf{b}_{WLS} = \boldsymbol \beta \tag{15.5} \end{equation}\] and \[\begin{equation} \mathrm{Var}~\mathbf{b}_{WLS} = \left(\mathbf{X}^{\prime} \mathbf{W}\mathbf{X} \right)^{-1} \left(\mathbf{X}^{\prime} \mathbf{W}\mathbf{V}\mathbf{W}\mathbf{X} \right) \left(\mathbf{X}^{\prime} \mathbf{W}\mathbf{X} \right)^{-1} . \tag{15.6} \end{equation}\] Equation (15.5) indicates \(\mathbf{b}_{WLS}\) is an unbiased estimator of \(\boldsymbol \beta\). Equation (15.6) is a basic result that is used for statistical inference, including evaluation of standard errors.
The best choice of the weight matrix is the inverse of the variance-covariance matrix so that \(\mathbf{W}=\mathbf{V}^{-1}\). This choice results in the generalized least squares estimator,* commonly denoted by the acronym \(GLS\). The variance is \[\begin{equation} \mathrm{Var}~\mathbf{b}_{GLS} = \left(\mathbf{X}^{\prime} \mathbf{V}^{-1}\mathbf{X} \right)^{-1} . \tag{15.7} \end{equation}\] This is best in the sense that it can be shown that \(\mathbf{b}_{GLS} = \left(\mathbf{X}^{\prime} \mathbf{V}^{-1}\mathbf{X} \right)^{-1}\mathbf{X}^{\prime} \mathbf{V}^{-1}\mathbf{y}\) has minimum variance among the class of all unbiased estimators of the parameter vector \(\boldsymbol \beta\). This is property is known as the \(Gauss-Markov ~Theorem\), an extension for general variance-covariance matrices \(\mathbf{V}\) of the property introduced in Section 3.2.3.
15.1.2 Variance Components Estimation
Generalized least squares estimation assumes that \(\mathbf{V}\) is known, at least up to a scalar constant. Of course, it is unlikely that a general \(n \times n\) matrix \(\mathbf{V}\) could be estimated from \(n\) observations. However, estimation of special cases of \(\mathbf{V}\) is possible and done routinely. Let \(\boldsymbol \tau\) denote the vector of parameters that index \(\mathbf{V}\); once \(\boldsymbol \tau\) is known, the matrix \(\mathbf{V}\) is fully specified. We call elements of \(\boldsymbol \tau\) the variance components. For example, in our basic regression case we have \(\mathbf{V} = \sigma^2 \mathbf{I}\), so that \(\boldsymbol \tau = \sigma^2\). As another example, in the basic one-way random effects model, the variance structure is described by the variance components \(\boldsymbol \tau = (\sigma^2, \sigma^2_{\alpha})^{\prime}\).
There are several methods for estimating variance components, some of which are likelihood based and others that use method of moments. These methods are readily available in statistical software. To give readers a feel for the computations involved, we briefly sketch the procedure based on maximum likelihood using normal distributions.
For normally distributed observations \(\mathbf{y}\) with mean E \(\mathbf{y} = \mathbf{X} \boldsymbol \beta\) and Var \(\mathbf{y} = \mathbf{V} = \mathbf{V (\boldsymbol \tau)}\), the logarithmic likelihood is given by \[\begin{equation} L(\boldsymbol \beta, \boldsymbol \tau ) = - \frac{1}{2} \left[ N \ln (2 \pi) + \ln \det (\mathbf{V (\boldsymbol \tau)}) + (\mathbf{y} - \mathbf{X} \boldsymbol \beta)^{\prime} \mathbf{V (\boldsymbol \tau)}^{-1} (\mathbf{y} - \mathbf{X} \boldsymbol \beta) \right]. \tag{15.8} \end{equation}\]
This log-likelihood is to be maximized in terms of the parameters \(\boldsymbol \beta\) and \(\boldsymbol \tau\). In the first stage, we hold \(\boldsymbol \tau\) fixed and maximize equation (15.8) over \(\boldsymbol \beta\). Pleasant calculations show that \(\mathbf{b}_{GLS}\) is in fact the maximum likelihood estimator of \(\boldsymbol \beta\). Putting this into equation (15.8) yields the “profile” likelihood \[\begin{equation} \small{ L_P(\boldsymbol \tau ) = L(\mathbf{b}_{GLS}, \boldsymbol \tau ) \propto - \frac{1}{2}\left[ \ln \det (\mathbf{V (\boldsymbol \tau)}) + (\mathbf{y} - \mathbf{X} \mathbf{b}_{GLS})^{\prime} \mathbf{V (\boldsymbol \tau)}^{-1} (\mathbf{y} - \mathbf{X} \mathbf{b}_{GLS}) \right] , } \tag{15.9} \end{equation}\] where we have dropped constants that do not depend on \(\boldsymbol \tau\). (The symbol \(\propto\) means “is proportional to.”)
To implement this two-stage procedure, computer software will typically use ordinary least squares (OLS) estimates b for starting values. Then, in the second stage, estimates of \(\boldsymbol \tau\) are determined by iterative methods (numerical optimization) by finding the values of \(\boldsymbol \tau\) that maximize \(L(\mathbf{b},\boldsymbol \tau)\). These estimates are then used to update the regression coefficient estimates using weighted least squares. This process is continued until convergence is achieved.
There are two advantages to this two-stage procedure. First, by decoupling the regression from the variance component parameters estimation, we can apply any method that we like to the variance components and then “plug-in” these estimates into the regression component (estimated) generalized least squares estimation. Second, we have a closed-form expression for the regression estimates. This is faster computationally than the iterative methods required by general optimization routines.
15.1.3 Best Linear Unbiased Prediction
This section develops best linear unbiased predictors (BLUPs) in the context of mixed linear models. We introduce BLUPs as the minimum mean square error predictor of a random variable, w. This development is originally due to Goldberger (1962), who coined the phrase “best linear unbiased predictor.” The acronym BLUP was first used by Henderson (1973).
The generic goal is to predict a random variable w, such that \(\mathrm{E}~ w = \boldsymbol \lambda ^{\prime} \boldsymbol \beta\) and \(\mathrm{Var}~ w = \sigma^2_w\). Denote the covariance between \(w\) and \(\mathbf{y}\) as the \(1 \times N\) vector \(\mathrm{Cov}(w,\mathbf{y}) = \mathrm{E}\{(w-\mathrm{E}w)(\mathbf{y}-\mathrm{E}\mathbf{y})^{\prime} \}\). The choice of \(w\), and thus \(\boldsymbol \lambda\) and \(\sigma^2_w\), will depend on the application at hand.
Under these assumptions, it can be shown that the \(BLUP\) of \(w\) is \[\begin{equation} w_{BLUP} = \boldsymbol \lambda ^{\prime} \mathbf{b}_{GLS} + \mathrm{Cov}(w,\mathbf{y})\mathbf{V}^{-1}(\mathbf{y}-\mathbf{X} \mathbf{b}_{GLS}). \tag{15.10} \end{equation}\] The \(BLUP\) predictors are optimal, assuming the variance components implicit in \(\mathbf{V}\) and \(\mathrm{Cov}(w,\mathbf{y})\) are known. Applications of BLUP typically require that the variance components be estimated, as described in Section 15.1.2. BLUPs with estimated variance components are known as empirical BLUPs, or EBLUPs.
There are three important types of choice for \(w\),
- \(w=\varepsilon\), resulting in so-called “\(BLUP\) residuals,”
- random effects, such as \(\boldsymbol \alpha\), and
- future observations, resulting in optimal forecasts.
For the first choice, you will find that \(BLUP\) residuals are regularly coded in statistical software packages that fit linear mixed models. For the second choice, by letting \(w\) be an arbitrary linear combination of random effects, it can be shown that the \(BLUP\) predictor of \(\boldsymbol \alpha\) is \[\begin{equation} \mathbf{a}_{BLUP} = \mathbf{D Z}^{\prime} \mathbf{V}^{-1} (\mathbf{y} - \mathbf{X b}_{GLS}). \tag{15.11} \end{equation}\] For examples of the third choice, forecasting with linear mixed models, we refer to Frees (2004, Chapters 4 and 8).
To consider an application of equation (15.11), consider the following.
Special case: One-way Random Effects Model. Consider the model based on equation (15.1) and suppose that we wish to estimate the conditional mean of the \(i\)th group, \(w=\mu + \alpha_i.\) Then, direct calculations (see Frees, 2004, Chapter 4) based on equation (15.11) show that the \(BLUP\) is \[\begin{equation} \zeta_i \bar{y}_i + (1-\zeta_i ) m_{\alpha,GLS} , \tag{15.12} \end{equation}\] with weight \(\zeta_i = T_i /(T_i + \sigma^2/\sigma^2_{\alpha})\) and \(GLS\) estimate of \(\mu\), \(m_{\alpha,GLS} = \sum_i \zeta_i \bar{y}_i / \sum_i \zeta_i\). In Chapter 18, we will interpret \(\zeta_i\) to be a credibility factor.
15.2 Bayesian Regression
With Bayesian statistical models, one views both the model parameters and the data as random variables. In this section, we use a specific type of Bayesian model, the normal linear hierarchical model discussed by, for example, Gelman et al. (2004). As with the two-stage sampling scheme described in Section 3.3.1, the hierarchical linear model is one that is specified in stages. Specifically, we consider the following two-level hierarchy:
- Given the parameters \(\boldsymbol \alpha\) and \(\boldsymbol \beta\), the response model is \(\mathbf{y} = \mathbf{Z}\boldsymbol \alpha + \mathbf{X}\boldsymbol \beta + \boldsymbol \varepsilon\). This level is an ordinary (fixed) linear model that was introduced in Chapters 3 and 4. Specifically, we assume that the vector of responses \(\mathbf{y}\) conditional on \(\boldsymbol \alpha\) and \(\boldsymbol \beta\) is normally distributed and that E (\(\mathbf{y} | \boldsymbol \alpha, \boldsymbol \beta ) = \mathbf{Z}\boldsymbol \alpha + \mathbf{X}\boldsymbol \beta\) and Var (\(\mathbf{y} | \boldsymbol \alpha, \boldsymbol \beta) = \mathbf{R}\).
- Assume that \(\boldsymbol \alpha\) is distributed normally with mean \(\boldsymbol{\mu _{\alpha}}\) and variance \(\mathbf{D}\) and that \(\boldsymbol \beta\) is distributed normally with mean \(\boldsymbol{\mu _{\beta}}\) and variance \(\boldsymbol{\Sigma _{\beta}}\) , each independent of the other.
The technical differences between the mixed linear model and the normal hierarchical linear model are:
- In the mixed linear model, \(\boldsymbol \beta\) is an unknown, fixed parameter whereas in the normal hierarchical linear model, \(\boldsymbol \beta\) is a random vector, and
- the mixed linear model is distribution-free, whereas distributional assumptions are made in each stage of the normal hierarchical linear model.
Moreover, there are important differences in interpretation. To illustrate, suppose that \(\boldsymbol \beta= \mathbf{0}\) with probability one. In the classic non-Bayesian, also known as the frequentist, interpretation, we think of the distribution of \(\{\boldsymbol \alpha\}\) as representing the likelihood of drawing a realization of \(\boldsymbol \alpha _i\). The likelihood interpretation is most suitable when we have a population of firms or people and each realization is a draw from that population. In contrast, in the Bayesian case, one interprets the distribution of \(\{\boldsymbol \alpha\}\) as representing the knowledge that one has of this parameter. This distribution may be subjective and allows the analyst a formal mechanism to inject his or her assessments into the model. In this sense the frequentist interpretation may be regarded as a special case of the Bayesian framework.
The joint distribution of \((\boldsymbol \alpha^{\prime}, \boldsymbol \beta^{\prime})^{\prime}\) is known as the prior distribution. To summarize, the joint distribution of \((\boldsymbol \alpha^{\prime}, \boldsymbol \beta^{\prime}, \mathbf{y}^{\prime})^{\prime}\) is
\[\begin{equation} \left( \begin{array}{c} \boldsymbol \alpha \\ \boldsymbol \beta \\ \mathbf{y} \\ \end{array} \right) \sim N \left( \left( \begin{array}{c} \boldsymbol {\mu_{\alpha}} \\ \boldsymbol {\mu_{\beta}} \\ \mathbf{Z}\boldsymbol {\mu_{\alpha}} + \mathbf{X}\boldsymbol {\mu_{\beta}} \\ \end{array} \right) , \left(\begin{array}{ccc} \mathbf{D} & \mathbf{0} & \mathbf{DZ}^{\prime} \\ \mathbf{0} & \boldsymbol {\Sigma_{\beta}} & \boldsymbol {\Sigma_{\beta}}\mathbf{X}^{\prime} \\ \mathbf{ZD} & \mathbf{X}\boldsymbol {\Sigma_{\beta}} & \mathbf{V} + \mathbf{X}\boldsymbol {\Sigma_{\beta}} \mathbf{X}^{\prime}\\ \end{array} \right) \right) , \tag{15.13} \end{equation}\] where \(\mathbf{V = R + Z D }\mathbf{Z}^{\prime}\).
The distribution of parameters given the data is known as the posterior distribution. To calculate this conditional distribution, we use standard results from multivariate analysis. Specifically, the posterior distribution of \((\boldsymbol \alpha^{\prime}, \boldsymbol \beta^{\prime})^{\prime}\) given \(\mathbf{y}\) is normal. It is not hard to verify that the conditional mean is \[\begin{equation} \mathrm{E}~ \left( \begin{array}{c} \boldsymbol \alpha \\ \boldsymbol \beta \\ \end{array} \right) | \mathbf{y} = \left( \begin{array}{c} \boldsymbol {\mu_{\alpha}} + \mathbf{DZ}^{\prime} (\mathbf{V} + \mathbf{X}\boldsymbol {\Sigma_{\beta}} \mathbf{X}^{\prime})^{-1} (\mathbf{y} -\mathbf{Z}\boldsymbol {\mu_{\alpha}} - \mathbf{X}\boldsymbol {\mu_{\beta}}) \\ \boldsymbol {\mu_{\beta}} + \boldsymbol {\Sigma_{\beta}}\mathbf{X}^{\prime} (\mathbf{V} + \mathbf{X}\boldsymbol {\Sigma_{\beta}} \mathbf{X}^{\prime})^{-1} (\mathbf{y} -\mathbf{Z}\boldsymbol {\mu_{\alpha}} - \mathbf{X}\boldsymbol {\mu_{\beta}}) \\ \end{array} \right) . \tag{15.14} \end{equation}\]
Up to this point, the treatment of parameters \(\boldsymbol \alpha\) and \(\boldsymbol \beta\) has been symmetric. In some applications, such as with longitudinal data, one typically has more information about the global parameters \(\boldsymbol \beta\) than subject-specific parameters \(\boldsymbol \alpha\). To see how the posterior distribution changes depending on the amount of information available, we consider two extreme cases.
First, consider the case \(\boldsymbol{\Sigma _{\beta}}= \mathbf{0}\), so that \(\boldsymbol \beta=\boldsymbol{\mu _{\beta}}\) with probability one. Intuitively, this means that \(\boldsymbol \beta\) is precisely known, generally from collateral information. Then, from equation (15.14), we have
\[\begin{equation} \mathrm{E}~ ( \boldsymbol \alpha | \mathbf{y}) = \boldsymbol {\mu_{\alpha}} + \mathbf{DZ}^{\prime} \mathbf{V}^{-1} (\mathbf{y} -\mathbf{Z}\boldsymbol {\mu_{\alpha}} - \mathbf{X}\boldsymbol \beta) . \tag{15.15} \end{equation}\] Assuming that \(\boldsymbol{\mu _{\alpha}}= \mathbf{0}\), the best linear unbiased estimator of E (\(\boldsymbol \alpha | \mathbf{y}\)) is \[ \mathbf{a}_{BLUP} = \mathbf{D Z}^{\prime} \mathbf{V}^{-1} (\mathbf{y} - \mathbf{X b}_{GLS}). \] Recall from equation (15.11) that \(\mathbf{a}_{BLUP}\) is also the best linear unbiased predictor in the frequentist (non-Bayesian) model framework.
Second, consider the case where \(\boldsymbol{\Sigma _{\beta}}^{-1}= \mathbf{0}\). In this case, prior information about the parameter \(\boldsymbol \beta\) is vague; this is known as using a diffuse prior. In this case, one can check that
\[ \mathrm{E}~ (\boldsymbol \alpha | \mathbf{y}) \rightarrow \mathbf{a}_{BLUP}, \] as \(\boldsymbol{\Sigma _{\beta}}^{-1}\rightarrow \mathbf{0}\). (See, for example, Frees, 2004, Section 4.6.)
Thus, it is interesting that in both extreme cases, we arrive at the statistic \(\mathbf{a}_{BLUP}\) as a predictor of \(\boldsymbol \alpha\). This analysis assumes \(\mathbf{D}\) and \(\mathbf{R}\) are matrices of fixed parameters. It is also possible to assume distributions for these parameters; typically, independent Wishart distributions are used for \(\mathbf{D}^{-1}\) and \(\mathbf{R}^{-1}\) as these are conjugate priors. Alternatively, one can estimate \(\mathbf{D}\) and \(\mathbf{R}\) using methods described in Section 15.1. The general strategy of substituting point estimates for certain parameters in a posterior distribution is called empirical Bayes estimation.
To examine intermediate cases, we look to the following special case. Generalizations may be found in Luo, Young and Frees (2001).
Special Case: One-way Random Effects Model. We return to the model considered in equation (15.2) and, for simplicity, assume balanced data so that \(T_i = T\). The goal is to determine the posterior distributions of the parameters. For illustrative purposes, we focus on the posterior means. Thus, re-writing equation (15.2), the model is \[ y_{it} = \beta + \alpha_i + \varepsilon_{it}, \] where we use the random \(\beta \sim N(\mu_{\beta}, \sigma^2_{\beta})\) in lieu of the fixed mean \(\mu\). The prior distribution of \(\alpha_i\) is independent with \(\alpha_i \sim N(0, \sigma^2_{\alpha})\).
Using equation (15.14), we obtain the posterior mean of \(\beta\), \[\begin{equation} \hat{\beta} = \mathrm{E}~(\beta| \mathbf{y}) = \left( \frac{1}{\sigma^2_{\beta}}+ \frac{nT}{\sigma^2_{\varepsilon}+T\sigma^2_{\alpha}} \right)^{-1} \left( \frac{nT}{\sigma^2_{\varepsilon}+T\sigma^2_{\alpha}} \bar{y} + \frac{\mu}{\sigma^2_{\beta}} \right) , \tag{15.16} \end{equation}\] after some algebra. Thus, \(\hat{\beta}\) is a weighted average of the sample mean, \(\bar{y}\), and the prior mean, \(\mu_{\beta}\). It is easy to see that \(\hat{\beta}\) approaches the sample mean as \(\sigma^2_{\beta} \rightarrow \infty\), that is, as prior information about \(\beta\) becomes “vague.” Conversely, \(\hat{\beta}\) approaches the prior mean \(\mu_{\beta}\) as \(\sigma^2_{\beta} \rightarrow 0\), that is, as information about becomes “precise.”
Similarly, using equation (15.14), the posterior mean of \(\alpha_i\) is \[ \hat{\alpha_i} = \mathrm{E}~(\alpha_i | \mathbf{y}) = \zeta \left[ ( \bar{y}_i - \mu_{\beta} ) - \zeta_{\beta} (\bar(y) \mu_{\beta} ) \right] \] where we have that \[ \zeta = \frac{T \sigma^2_{\alpha}}{\sigma^2_{\varepsilon}+T \sigma^2_{\alpha}} \] and define \[ \zeta_{\beta} = \frac{nT \sigma^2_{\beta}}{\sigma^2_{\varepsilon}+T \sigma^2_{\alpha}+nT \sigma^2_{\beta}} . \] Note that \(\zeta_{\beta}\) measures the precision of knowledge about \(\beta\). Specifically, we see that \(\zeta_{\beta}\) approaches one as \(\sigma^2_{\beta} \rightarrow \infty\), and approaches zero as \(\sigma^2_{\beta} \rightarrow 0\).
Combining these two results, we have that \[ \hat{\alpha_i} +\hat{\beta} = (1-\zeta_{\beta}) \left[ (1-\zeta) \mu_{\beta} + \zeta \bar{y}_i \right] + \zeta_{\beta} \left[ (1-\zeta)\bar{y} + \zeta\bar{y}_i \right] . \] Thus, if our knowledge of the distribution of \(\beta\) is vague, then \(\zeta_{\beta} =1\) and the predictor reduces to the expression in equation (15.12) (for balanced data). Conversely, if our knowledge of the distribution of \(\beta\) is precise, then \(\zeta_{\beta} =0\) and the predictor reduces to the expression given in Chapter 18. With the Bayesian formulation, we may entertain situations where knowledge is available although imprecise.
To summarize, there are several advantages of the Bayesian approach. First, one can describe the entire distribution of parameters conditional on the data. This allows one, for example, to provide probability statements regarding the likelihood of parameters. Second, this approach allows analysts to blend information known from other sources with the data in a coherent manner. In our development, we assumed that information may be known through the vector of \(\boldsymbol \beta\) parameters, with their reliability control through the dispersion matrix \(\boldsymbol{\Sigma _{\beta}}\). Values of \(\boldsymbol{\Sigma _{\beta}}=\mathbf{0}\) indicate complete faith in values of \(\boldsymbol{\mu _{\beta}}\), whereas values of \(\boldsymbol{\Sigma _{\beta}}^{-1}=\mathbf{0}\) indicate complete reliance on the data in lieu of prior knowledge.
Third, the Bayesian approach provides for a unified approach for estimating \((\boldsymbol \alpha, \boldsymbol \beta)\). Section 15.1 on non-Bayesian methods required a separate subsection on variance components estimation. In contrast, in Bayesian methods, all parameters can be treated in a similar fashion. This is convenient for explaining results to consumers of the data analysis. Fourth, Bayesian analysis is particularly useful for forecasting future responses.
15.3 Density Estimation and Scatterplot Smoothing}
When exploring a variable or relationships between two variables, one often wishes to get an overall idea of patterns without imposing strong functional relationships. Typically graphical procedures work well because we can comprehend potentially nonlinear relationships more readily visually than with numerical summaries. This section introduces (kernel) density estimation to visualize the distribution of a variable and scatterplot smoothing to visualize the relationship between two variables.
To get a quick impression of the distribution of a variable, a histogram is easy to compute and interpret. However, as suggested in Chapter 1, changing the location and size of rectangles that comprise the histogram can give viewers different impression of the distribution. To introduce an alternative, suppose that we have a random sample \(y_1, \ldots, y_n\) from a probability density function f(.). We define the kernel density estimator \[ \hat{\mathrm{f}}(y) = \frac{1}{n b_n} \sum_{i=1}^n \mathrm{k}\left(\frac{y-y_i}{b_n}\right), \] where \(b_n\) is a small number called a bandwidth and k(.) is a probability density function called a kernel.
To develop intuition, we first consider the case where the kernel k(.) is a probability density function for a uniform distribution on (-1,1). For the uniform kernel, the kernel density estimate counts the number of observations \(y_i\) that are within \(b_n\) units of \(y\), and then expresses the density estimate as the count divided by the sample size times the rectangle width (that is, the count divided by \(n \times 2 b_n\)). In this way, it can be viewed as a “local” histogram estimator in the sense that the center of the histogram depends on the argument \(y\).
There are several possibilities for the kernel. Some widely used choices are:
- the uniform kernel, \(\mathrm{k}(u) = \frac{1}{2}\) for \(-1 \leq u \leq 1\) and 0 otherwise,
- the “Epanechikov” kernel, \(\mathrm{k}(u) = \frac{3}{4}(1-u^2)\) for \(-1 \leq u \leq 1\) and 0 otherwise, and
- the gaussian kernel, \(\mathrm{k}(u) = \phi(u)\) for \(-\infty < u < \infty\), the standard normal density function.
The Epanechnikov kernel is a smoother version that uses a quadratic polynomial so that discontinuous rectangles are not used. The gaussian kernel is yet more continuous in the sense that the domain is no longer plus or minus \(b_n\) but is the whole real line.
The bandwidth \(b_n\) controls the amount of averaging. To see the effects of different bandwidth choices, we consider a dataset on nursing home utilization that will be introduced in Section 17.3.2. Here, we consider occupancy rates, a measure of nursing home utilization. A value of 100 means full occupancy although because of the way this measure is constructed, it is possible for values to exceed 100. Specifically, there are \(n=349\) occupancy rates that are displayed in Figure 15.1. Both figures use a gaussian kernel. The left-hand panel is based on a bandwidth of 0.1. This panel appears very ragged; the relatively small bandwidth means that there is little averaging being done. For the outlying points, each spike represents a single observation. In contrast, the right-hand panel is based on a bandwidth of 1.374. In comparison to the left-hand panel, this picture displays a smoother picture, allowing the analyst to search for patterns and not be distracted by jagged edges. From this panel, we can readily see that most of the mass is less than 100 percent. Moreover, the distribution is left-skewed, with values of 100-120 being rare.
The bandwidth 1.374 was selected using an automatic procedure built into the software. These automatic procedures choose the bandwidth to find the best trade off between the accuracy and the smoothness of the estimates. (For this figure, we used the statistical software “R” that has Silverman’s procedure built in.)
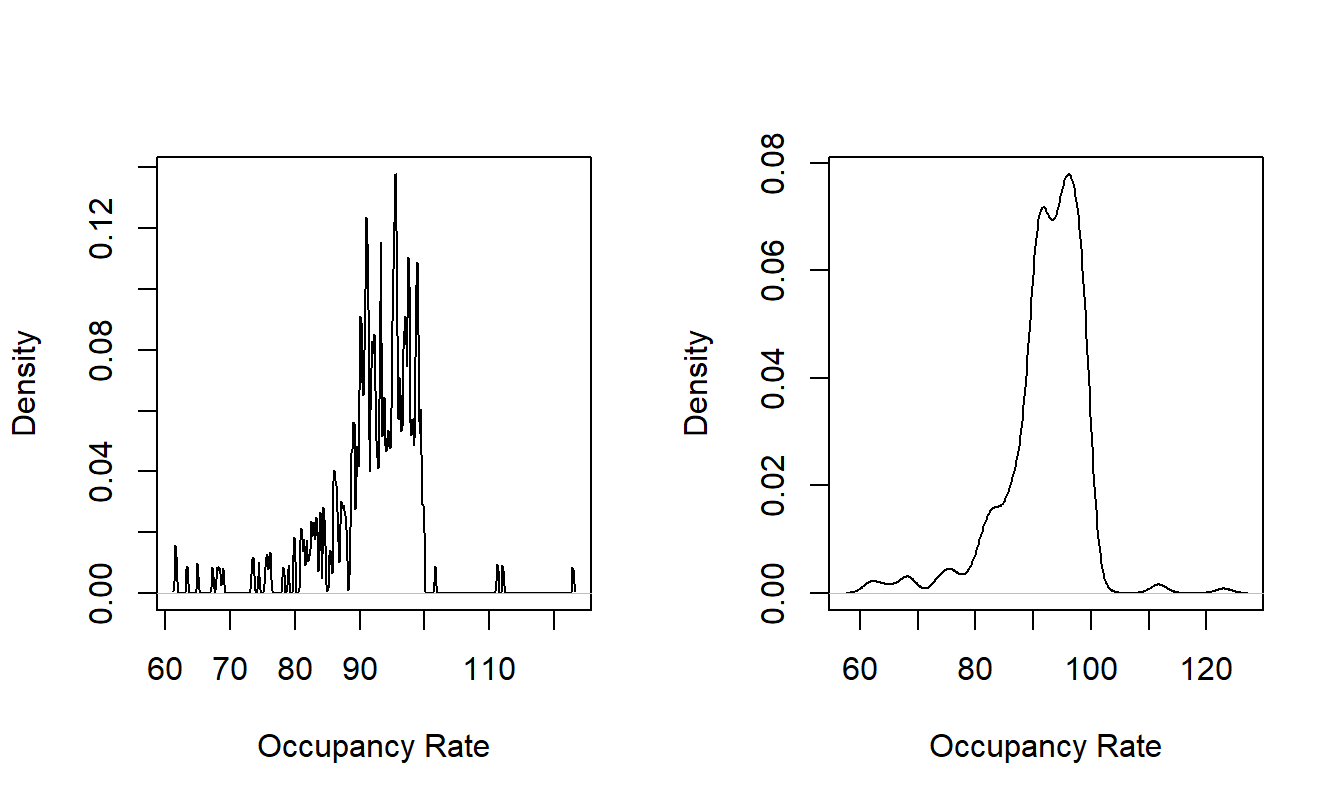
Figure 15.1: Kernel Density Estimates of Nursing Home Occupancy Rates With Different Bandwidths. The left-hand panel is based on a bandwidth = 0.1, the right-hand panel is based a bandwidth = 1.374.
Kernel density estimates also depend on the choice of the kernel although this is typically much less important in applications than the choice of the bandwidth. To show the effects of different kernels, we show only the \(n=3\) occupancy rates that exceeded 110 in Figure 15.2. The left-hand panel shows the stacking of rectangular histograms based on the uniform kernel. The smoother Epanechnikov and gaussian kernels in the middle and right-hand panels are visually indistinguishable. Unless you are working with very small sample sizes, you will usually not need be concerned about the choice of the kernel. Some analysts prefer the uniform kernel because of its interpretability, some prefer the gaussian because of its smoothness and some prefer the Epanechnikov kernel as a reasonable compromise.
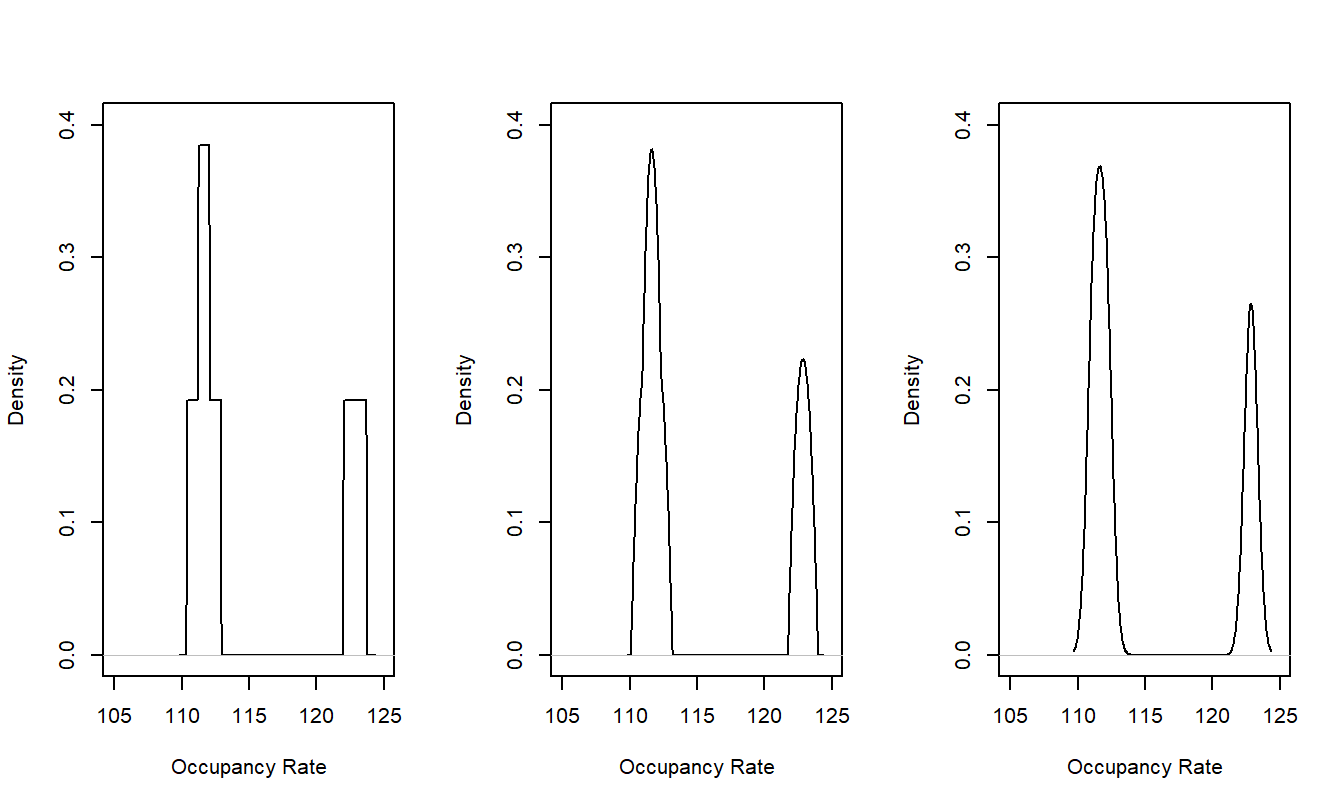
Figure 15.2: Kernel Density Estimates of Nursing Home Occupancy Rates With Different Kernels. From left to right, the panels use the uniform, Epanechnikov and gaussian kernels.
R Code to Produce Figures 15.1 and 15.2
Some scatterplot smoothers, that show relationships between an \(x\) and a \(y\), can also be described in terms of kernel estimation. Specifically, a kernel estimate of the regression function E (\(y |x\)) is \[ \hat{\mathrm{m}}(x) = \frac{\sum_{i=1}^n w_{i,x} y_i}{\sum_{i=1}^n w_{i,x}} \] with the “local” weight \(w_{i,x} = \mathrm{k}\left( (x_i - x)/b_n \right)\). This is the now-classic Nadaraya-Watson estimator (see, for example, Ruppert, Wand and Carroll, 2003).
More generally, for a \(p\)th order local polynomial fit, consider finding parameter estimates \(\beta_0, \ldots, \beta_p\) that minimize \[\begin{equation} \sum_{i=1}^n \left\{ y_i - \beta_0 - \cdots - \beta_p (x_i - x)^p \right\}^2 w_{i,x} . \tag{15.17} \end{equation}\] The best value of the intercept \(\beta_0\) is taken to be the estimate of the regression function E (\(y |x\)). Ruppert, Wand and Carroll (2003) recommend values of \(p\) =1 or 2 for most applications (the choice \(p=0\) yields the Nadaraya-Watson estimator). As a variation, taking \(p=1\) and letting the bandwidth vary so that the number of points used to estimate the regression function is fixed results in the lowess estimator (for “local regression”) due to Cleveland (see, for example, Ruppert, Wand and Carroll, 2003). As an example, we used the lowess estimator in Figure 6.11 to get a sense of the relationship between the residuals and the riskiness of an industry as measured by INDCOST. As an analyst, you will find that kernel density estimators and scatterplot smoothers are quite straightforward to use when searching for patterns and developing models.
15.4 Generalized Additive Models
Classic linear models are based on the regression function \[ \mu = \mathrm{E} (y| x_1, \ldots, x_k) = \beta_0 + \sum _{j=1}^k \beta_j x_j . \] With a generalized linear model (GLM), we have seen that we can substantially extend applications through a function that links the mean to the systematic component, \[ \mathrm{g} \left(\mu \right) = \beta_0 + \sum _{j=1}^k \beta_j x_j , \] from equation (13.1). As in linear models, the systematic component is linear in the parameters \(\beta_j\), not necessarily the underlying explanatory variables. For example, we have seen that we can use polynomial functions (such as \(x^2\) in Chapter 3), trigonometric functions (such as \(\sin x\) in Chapter 8), binary and categorizations in Chapter 4 and the “broken stick” (piecewise linear) representation in Section 3.5.2.
The generalized additive model (GAM) extends the GLM by allowing each explanatory variable to be replaced by a function that may be nonlinear, \[\begin{equation} \mathrm{g} \left( \mu \right) = \beta_0 + \sum _{j=1}^k \beta_j ~\mathrm{m}_j(x_j) . \tag{15.18} \end{equation}\] Here, the function \(\mathrm{m}_j(\cdot)\) may differ by explanatory variable. Depending on the application, \(\mathrm{m}_j(\cdot)\) may include the traditional parametric specifications (such as polynomials and categorizations) as well as more flexible nonparametric specifications such as the scatterplot smoothers introduced in Section 15.3.
For example, suppose that we have a large insurance database and wish to model the probability of a claim. Then, we might use the model \[ \ln \left(\frac{\pi}{1-\pi} \right) = \beta_0 + \sum _{j=1}^k \beta_j x_j + \mathrm{m}(z) . \] The left-hand side is the usual logit link function used in logistic regression, with \(\pi\) being the probability of a claim. For the right-hand side, we might consider a host of rating variables, such as territory, gender and type of vehicle or house (depending on the coverage), that are included in the linear component \(\beta_0 + \sum _{j=1}^k \beta_j x_j\). The additional variable \(z\) is some continuous variable (such as age) that we wish to allow for the possibility of nonlinear effects. For the function \(\mathrm{m}(z)\), we could use a \(p\)th order polynomial fit with discontinuities at several ages, such as in equation (15.17).
This is known as a semiparametric model, in that the systematic component consists of parametric (\(\beta_0 + \sum _{j=1}^k \beta_j x_j\)) as well as nonparametric (\(\mathrm{m}(z)\)) pieces. Although we do not present the details here, modern statistical software allows the simultaneous estimation of parameters from both components. For example, the statistical software SAS implements generalizes additive models in its PROC GAM procedure as does the software R through the VGAM package.
The specification of the GAM in equation (15.18) is quite general. For a narrower class, the choice of g(\(\cdot\)) as the identity function yields the additive model. Although general, the nonparametric forms of \(\mathrm{m}_j(\cdot)\) make the model more flexible, yet the additivity allows us to interpret the model in much the same way as before. Readers interested in further information about GAMs will find Ruppert, Wand and Carroll (2003) and Hastie, Tibshirani and Freedman (2001) to be useful resources.
15.5 Bootstrapping
The bootstrap is a general tool for assessing the distribution of a statistic. We first describe the general procedure and then discuss ways of implementing it in a regression context.
Suppose that we have an i.i.d. sample \(\{z_1, \ldots, z_n \}\) from a population. From these data, we wish to understand the reliability of a statistic \(\mathrm{S}(z_1, \ldots, z_n )\). To calculate a bootstrap distribution, we compute:
- Bootstrap Sample. Generate an i.i.d sample of size \(n\), \(\{z^{\ast}_{1r}, \ldots, z^{\ast}_{nr} \}\), from \(\{z_1, \ldots, z_n \}\).
- Bootstrap Replication. Calculate the bootstrap replication, \(S^{\ast}_r =\mathrm{S}(z^{\ast}_{1r}, \ldots, z^{\ast}_{nr} )\).
Repeat steps (i) and (ii) \(r=1, \ldots, R\) times, where \(R\) is a large number of replications. In the first step, the bootstrap sample is randomly drawn from the original sample with replacement. When repeating steps (i) and (ii), the bootstrap samples are independent of one another, conditional on the original sample \(\{z_1, \ldots, z_n \}\). The resulting bootstrap distribution, \(\{S^{\ast}_1, \ldots, S^{\ast}_R\}\), can be used to assess the distribution of the statistic \(S\).
There are three variations of this basic procedure used in regression. In the first variation, we treat \(z_i = (y_i, \mathbf{x}_i)\), and use the basic bootstrap procedure. This variation is known as resampling pairs.
In the second variation, we treat the regression residuals as the “original” sample and create a bootstrap sample by sampling the residuals. This variation is known as resampling residuals. Specifically, consider a generic regression model of the form \(y_i = \mathrm{F}(\mathbf{x}_i, \boldsymbol \theta, \varepsilon_i),\) where \(\boldsymbol \theta\) represents a vector of parameters. Suppose that we estimate this model and compute residuals \(e_i, i=1, \ldots, n\). In Section 13.5, we denoted the residuals as \(e_i = \mathrm{R}(y_i; \mathbf{x}_i,\widehat{\boldsymbol \theta})\) where the function “R” was determined by the model form and \(\widehat{\boldsymbol \theta}\) represents the estimated vector of parameters. The residuals may be the raw residuals, Pearson residuals or some other choice.
Using a bootstrap residual \(e^{\ast}_{jr}\), we can create a pseudo-response \[ y^{\ast}_{jr}= \mathrm{F}(\mathbf{x}_i, \widehat{\boldsymbol \theta}, e^{\ast}_{jr}). \] We can then use the set of pseudo-observations \(\{(y^{\ast}_{1r},\mathbf{x}_1), \ldots, (y^{\ast}_{nr},\mathbf{x}_n)\}\) to calculate the bootstrap replication \(S^{\ast}_r\). As above, the resulting bootstrap distribution, \(\{S^{\ast}_1, \ldots, S^{\ast}_R\}\), can be used to assess the distribution of the statistic \(S\).
Comparing these two options, the strengths of the first variation are that it employs fewer assumptions and is simpler to interpret. The limitation is that it uses a different set of explanatory variables \(\{ \mathbf{x}^{\ast}_{1r}, \ldots, \mathbf{x}^{\ast}_{nr} \}\) in the calculation of each bootstrap replication. Some analysts reason that their inference about the statistic \(S\) is conditional on the observed explanatory variables \(\{ \mathbf{x}_1, \ldots, \mathbf{x}_n \}\) and using a different set attacks a problem that is not of interest. The second variation addresses this, but at a cost of slightly less generality. In this variation, there is a stronger assumption that the analyst has correctly identified the model and that the disturbance process \(\varepsilon_i = \mathrm{R}(y_i; \mathbf{x}_i,\boldsymbol \theta)\) is i.i.d.
The third variation is known as a parametric bootstrap. Here, we assume that the disturbances, and hence the original dependent variables, come from a model that is known up to a vector of parameters. For example, suppose that we wish the accuracy of a statistic \(S\) from a Poisson regression. As described in Chapter 12, we assume that \(y_i \sim Poisson (\mu_i)\), where \(\mu_i = \exp(\mathbf{x}_i^{\prime} \boldsymbol \beta )\). The estimate of the regression parameters is \(\mathbf{b}\) and so the estimated mean is \(\widehat{\mu}_i = \exp(\mathbf{x}_i^{\prime} \mathbf{b} )\). From this, we can simulate to create a set of pseudo-responses \[ y^{\ast}_{ir}\sim Poisson (\widehat{\mu}_i), i=1,\ldots, n, ~~~r=1,\ldots, R. \] These pseudo-responses can be used to form the \(r\)th bootstrap sample, \(\{(y^{\ast}_{1r},\mathbf{x}_1), \ldots, (y^{\ast}_{nr},\mathbf{x}_n)\}\), and from this the bootstrap replication, \(S^{\ast}_r\). Thus, the main difference between the parametric bootstrap and the first two variations is that we simulate from a distribution (the Poisson, in this case), not from an empirical sample. The parametric bootstrap is easy to interpret and explain because the procedure is similar to the usual Monte Carlo simulation (see for example, Klugman et al., 2008). The difference is that with the bootstrap, we use the estimated parameters to calibrate the bootstrap sampling distribution whereas this distribution is assumed known in Monte Carlo simulation.
There are two commonly used ways to summarize the accuracy of the statistic \(S\) using the bootstrap distribution, \(\{S^{\ast}_1, \ldots, S^{\ast}_R\}\). The first, a model-free approach, involves using the percentiles of the bootstrap distribution to create a confidence interval for \(S\). For example, we might use the \(2.5^{th}\) and \(97.5^{th}\) percentiles of \(\{S^{\ast}_1, \ldots, S^{\ast}_R\}\) for a 95% confidence interval for \(S\). For the second, one assumes some distribution for \(S^{\ast}_r,\) typically approximate normality. With this approach, one can estimate a mean and standard deviation to get the usual confidence interval for \(S\).
Special Case: Bootstrapping Loss Reserves. England and Verrall (2002) discuss bootstrapping loss reserves. As we will see in Chapter 19, by assuming that losses follow an overdisperse Poisson, predictions for loss reserves can be obtained by a simple mechanistic procedure known as the chain-ladder technique. To bootstrap an overdisperse Poisson, as we saw in Chapter 12 this is a variation of a Poisson model, not a true probability distribution and so parametric bootstrapping is not readily available. Instead, England and Verrall showed how to use residual resampling, employing Pearson residuals.
In many instances, computation of the bootstrap replication \(S^{\ast}_r\) of the statistic can be computationally intensive, requiring specialized software. However, as pointed out by England and Verrall, the case of loss reserves with an overdisperse Poisson is straightforward. One essentially uses the chain-ladder technique to estimate model parameters and calculate Pearson residuals. Then, one simulates from the residuals, creates pseudo-responses and bootstrap distributions. Because simulation is widely available, the entire procedure can be readily mechanized to work with standard spreadsheet packages, without the need for statistical software. See Appendix 3 of England and Verrall (2002) for additional details on the algorithm.
15.6 Further Reading and References
The formula in equations (15.10) does not account for the uncertainty in variance component estimation. Inflation factors that account for this additional uncertainty have been proposed (Kackar and Harville, 1984, but they tend to be small, at least for data sets commonly encountered in practice. McCulloch and Searle (2001) provide further discussions.
Silverman (1986) is a now-classic introduction to density estimation.
Ruppert, Wand and Carroll (2003) provide an excellent book-long introduction to scatterplot smoothing. Moreover, they provide a complete discussion of spline-based smoothers, an alternative to local polynomial fitting.
Efron and Tibshirani (1991) is a now-classic introduction to the bootstrap.
References
- Efron, Bradley and Robert Tibshirani (1991). An Introduction to the Bootstrap. Chapman and Hall, London.
- England, Peter D. and Richard J. Verrall (2002). Stochastic claims reserving in general insurance. British Actuarial Journal 8, 443-544.
- Frees, Edward W. (2004). Longitudinal and Panel Data: Analysis and Applications in the Social Sciences. Cambridge University Press, New York.
- Frees, Edward W., Virginia R. Young and Yu Luo (2001). Case studies using panel data models. North American Actuarial Journal 5 (4), 24-42.
- Gelman, A., J. B. Carlin, H. S. Stern and D. B. Rubin (2004). Bayesian Data Analysis, Second Edition. Chapman & Hall, New York.
- Goldberger, Arthur S. (1962). Best linear unbiased prediction in the generalized linear regression model. Journal of the American Statistical Association 57, 369-75.
- Hastie, Trevor, Robert Tibshirani and Jerome Friedman (2001). The Elements of Statistical Learning: Data Mining, Inference and Prediction. Springer, New York.
- Henderson, C. R. (1973), Sire evaluation and genetic trends, in Proceedings of the Animal Breeding and Genetics Symposium in Honor of Dr. Jay L. Lush, 10-41. Amer. Soc. Animal Sci.-Amer. Dairy Sci. Assn. Poultry Sci. Assn., Champaign, Illinois.
- Kackar, R. N. and D. Harville (1984). Approximations for standard errors of estimators of fixed and random effects in mixed linear models. Journal of the American Statistical Association 79, 853-862.
- Klugman, Stuart A, Harry H. Panjer and Gordon E. Willmot (2008). Loss Models: From Data to Decisions. John Wiley & Sons, Hoboken, New Jersey.
- McCulloch, Charles E. and Shayle R. Searle (2001). Generalized, Linear and Mixed Models. John Wiley & Sons, New York.
- Pinheiro, José C. and Douglas M. Bates (2000). Mixed-Effects Models in S and S-PLUS. Springer-Verlag, New York.
- Ruppert, David, M.P. Wand and Raymond J. Carroll (2003). Semiparametric Regression. Cambridge University Press, Cambridge.
- Silverman, B. W. (1986). Density Estimation for Statistics and Data Analysis. Chapman and Hall, London.