| oliver at ssc dot wisc dot edu |
Pamela Oliver
Sociology Dept.
1180 Observatory Dr. Madison, Wisconsin
53706-1393
608-262-6829
|
|
Professor
Pamela Oliver
Department
of Sociology
|
|
Racial Disparities in Criminal Justice
Note: If you download information from this web site or
find it useful, I'd appreciate your sending me an email telling me about
it.
Sample graphs from our imprisonment trends files
 |
 |
US imprisonment rates are much higher than the rest of the world, and
within the US, African Americans are imprisoned at least eight times
as often as European Americans, while American Indians and Hispanics are
imprisoned at two to three times the European American rate. (Asian
American incarceration rates are generally lower than European American
rates.) About a third of African American men are under the supervision
of the criminal justice system, and about 12% of African American men
in their 20s and 30s are incarcerated. These astronomical incarceration
rates have huge social and economic consequences for black women, black
children, and black communities. They are not a legacy of Jim Crow, but
are a result of policies implemented since the mid-1970s which created
exponential growth in incarceration between 1975 and 2000. This growth
was not due to growing crime rates, but to greater use of incarceration
for lesser offenses and drug offenses. High incarceration rates ruin people's
lives and make the problem worse, by making it harder for young people
who have done wrong to be rehabilitated, find jobs, and become productive
members of society. Children whose parents are sent to prison are especially
harmed by these policies.
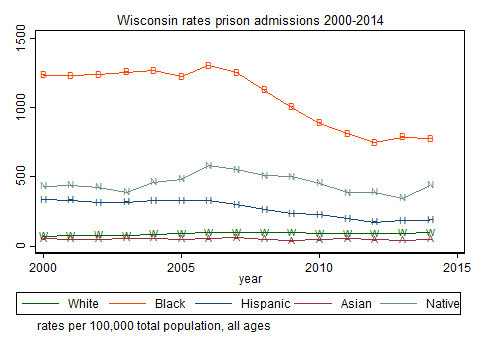
We have been doing a lot of analysis of the patterns of racial disparities
in Wisconsin and the US as a whole. Reports, spreadsheets, and graphic
displays are posted on this site for the purpose of providing information
to the public. Copyright is held by the University of Wisconsin. Materials
may be freely reproduced for use by the general public and nonprofit groups
or educational institutions as long as credit is given to the author.
This web site also includes links to reports, statistical resources, and
advocacy groups.
This research has been funded by the University of Wisconsin's Institute
for Research on Poverty and the National Science Foundation grant SPS0136833.
Any opinions, findings, and conclusions or recommendations expressed in
this material are those of the author(s) and do not necessarily reflect
the views of the National Science Foundation or the Institute for Research
on Poverty.
The Wisconsin Racial Disparities
Project
We are using public data to compare imprisonment and arrest rates for
different racial groups, separating these rates by type of crime.
We have done some analyses comparing US states to each other, and have
done a detailed county-level analysis of Wisconsin. Major findings:
- Wisconsin has very high black prison admission rates which rose steadily
through the 1990s, while Wisconsin's white incarceration rates rose
modestly. Graphic Display
- A major source of the rise is increased probation and parole revocations,
which rose for both races but more rapidly for blacks. Graphic
Display
- Whites are primarily sentenced to prison for violent offenses
and white prison admissions for violent offenses grew in the 1990s,
while drug sentences actually declined somewhat. Graphic
Display.
- By the late 1990s, most black new prison sentences were for
drug offenses. Black sentences for drug offenses rose in the 1990s while
sentences for serious crimes declined. Graphic
Display
Reports About Wisconsin
We are using public data to compare imprisonment and arrest rates for
different racial groups, separating these rates by type of crime.
We have done some analyses comparing US states to each other, and have
done a detailed county-level analysis of Wisconsin.
- New. Dane County in the 2000s.
- In 2006, an estimated 32% of Black men ages 18-54 were under the supervision of the Department of Corrections, 10% incarcerated and 22% under community supervision. The peak rate was for ages 25-29: an estimated 47% of Dane County's Black men aged 25-29 were under supervision, 15% in prison and another 32% on probation or parole or extended supervision. Tables of race X sex X age rates of imprisonment and correctional supervision.
- PDF copy of slides 2 to a page presented to Dane County Task Force on Racial Disparities January 29 2009.
- PowerPoint presentations. These are big files with lots of graphs
which I update periodically. Note that the imprisonment data generally
ends in the late 1990s (Wisconsin vs national) or the early 2000s (Wisconsin
DOC). NOTE: PowerPoint files require the PowerPoint software on your
computer to work. PDF files can be read with the Adobe Acrobat Reader,
which can be downloaded for free from their web site.
- Presentation October 2008 to Dane County Racism Summit (and Dane County Judges). Contains new graphs of Wisconsin & Dane County using DOC data through 2006. PDF file of slides 6 to a page. (file size ~ 3MB)
- General presentation. Compared to Wisconsin Sentencing Commission
presentation of 4/30/04, updated April 2007 to add more comparisons
between Wisconsin & the US in the 1980s and 1990s. PowerPoint
File. (file size ~ 2.6 MB) This one includes crime trends and
drug use graphs as well as suggestions about "what is to be
done"
- County comparisons in prison admissions 1990-2002.. PowerPoint
File
- Presentation to Governor's Commission on Racial Disparities May
22, 2007. PowerPoint File.
This overlaps a lot with the general presentation. Differs in omitting
slides on crime & drug use & my policy suggestions and in
adding slides summarizing the Sentencing Commission report on sentencing
disparities and in summaries of arrests rate disparities & prison/arrest
ratios for 1997-1999; also a few slides on the criminal justice
process and where data are & suggestions for where data are
needed.
- Presentation to Wisconsin Sentencing Commission April 30, 2004.
This presentation includes updated graphs on Wisconsin prison admissions
through 2003. And also includes comparisons between counties 1990-2003
(that is, includes item B above)
- PowerPoint presentation.
NOTE: This is a BIG FILE, about 4.5MB.
- PDF file, 4 slides
per page, landscape. This needs to print in color for the
graphics to be legible. File is about 450 KB (about 1/10th the
size of the PowerPoint file).
- PDF File of the slide
shots for my Wisconsin disparities presentation. Includes information
on national & state imprisonment trends, national drug use data,
and a special section on disparities by age. Wisconsin trends through
2003.
- Presentation on Dane County Returning Prisoners from the 1990s.
This presentation includes the slide I presented at the Sentencing
Commission showing returns to prison over time.
- PowerPoint
presentation.
- PDF
file, 4 slides per page, landscape. Needs to print in color.
- PowerPoint slide show with basic facts about escalating imprisonment
in US, Wisconsin, and Dane & Milwaukee Counties. Data through
1999 only
- Subset of slides with focus on Madison & Dane County. PowerPoint slides
Requires PowerPoint program to run. File size about 1.5 MB
- Slide show which emphasizes comparisons between counties in
imprisonment + some "talking points" about what we
can do. PowerPoint
slides. File size is about 3 MB
- PowerPoint presentation to the Governor's Juvenile Justice Commission's
Disproportionate Minority Confinement conference on February 4,
2002. Uses data through 1999. This is a very long slide show with
a couple of hundred slides. Requires the PowerPoint software. It
is broken into three parts.
- Part 1:
Overview and Wisconsin imprisonment patterns.
- Part 2:
Comparing Wisconsin's counties in black and white imprisonment.
Compares Milwaukee, Dane, Racine, Kenosha, Rock, and Waukesha
counties, and the rest of Wisconsin.
- Part
3: County arrest statistics and conclusions.
- Study of employment discrimination in Milwaukee against persons with
criminal records which shows racial bias as well. This is the study
I show in my slide show, which I did not do but was done by Devah Pager,
now a professsor at Princeton
University. The paper has been published in the American Journal
of Sociology, Volume 108 Number 5 (March 2003): 93775. Link
on her web site to a copy of this publication
- Spreadsheets with data and graphs
- Wisconsin Prison
Admissions 1990-1999 by race & county. This is a web page
with links to spreadsheets & technical analysis notes underlying
other summaries and PowerPoint presentations for 1990-1999.
- Gender &
Race trends in imprisonment. This is an Excel spreadshet with
graphics generated by Dana Garbarski using the Wisconsin Dept of
Corrections data through 2003.
- "Racial Disparities in Criminal Justice: Madison and Dane County
in Context." Institute for Research on Poverty Working Paper DP
1257-02. 2002. 48 pp. This is a report with embedded graphs. PDF
copy of this report. Link
to IRP download site for this and other reports.
- "Some Facts About Race and
Prison in Wisconsin" Forum article published in Wisconsin
State Journal May 26, 2002. Companion piece "What
Can We Do About Race, Crime, and Imprisonment?" by Helene Nelson
published in the same issue.
- Handout for Madison Urban Ministry forum on Community Policing March
19, 2002.
- Racial Disparities in Criminal
Justice: Madison and Dane County in Context. An outline report formatted
as an Adobe Acrobat file so it can be downloaded and printed. Many graphics
show how Wisconsin compares to the US and how Madison & Dane County
compare to Wisconsin and Milwaukee County. Originally presented to the
mayor on July 10, 2001, this version revised in Septemer 2001 contains
some corrections and additions. [A revision with a few corrections,
better formatting, and more textual explanation is in process and will
be posted soon.]
- Summary of Wisconsin
& Wisconsin county imprisonment patterns relative to the "drug
war." Prepared for CJAC conference in Milwaukee November 1, 2001.
- Graphs and charts on Racial
Disparities. Adobe Acrobat (PDF) color printout of PowerPoint slides,
printed 4 to a page.
- Summary of Dane County
black arrest & imprisonment patterns with emphasis on young offenders.
(Adobe Acrobat file)
- Racial Disparities in Imprisonment
in Wisconsin Written in 2000. Arrest and new imprisonment
rates for blacks and whites by offense category; imprisonment rates
by county and sex for blacks, whites, Hispanics, Asians, and American
Indians. Data are for 1996 and are from the National Corrections
Reporting Program. The report is an Adobe Acrobat file with tables in
the appendix.
- Uniform Crime Reports arrests of juveniles and adults in Dane County
1995, by race (converted to rates per 100,000 using 1995 Census estimates).
MS Word file.
- Handouts from the Peace-Filled Community forum March 20, 2001. Includes
black and white copies of figures about Wisconsin from slide show
+ Dane County and Milwaukee County new imprisonments by race and offense,
1996. MS Word file with lots
of graphics.
- Overview of Juvenile Justice
Issues in Dane County, Wisconsin Adobe Acrobat file.
- Racial Disparities in Imprisonment. Published in Money Educations
and Prison newsletter and The Madison Times Adobe
Acrobat file. HTML file
Reports About the US as a Whole and Theoretical
Implications
- "The Effect of Black Male
Imprisonment on Black Child Poverty." Pamela Oliver, Gary Sandefur,
Jessica Jakubowski, and James E. Yocom. Presented at the American Sociological
Association August 13, 2005. We find that high Black male imprisonment
contributes to high Black child poverty several years later. There are
two mechanisms. The first is lower family earnings, especially in two-parent
less-educated families, which is presumably due to the reduction in
earnings of men with prison records. The second is more complex: high
Black male imprisonment is associated with a rise over time in the proportion
of Black children living with mothers who have not graduated from high
school; this rise occurs despite an overall rise in Black mothers' education
and a positive association between Black male imprisonment and the proportion
of children living with mothers who are married college graduates. Due
to file sizes, the report and the tables are in two files. Report
text as PDF file Tables
as PDF file
- "Explaining State Black Imprisonment Rates 1983-1999."
Pamela E. Oliver and James E. Yocom. Multivariate analysis. Presented
at the American Sociological Association August 15, 2004. Two PDF format
files: 1)Text
2) Tables & Figures
- "Have High Black Imprisonment Rates Contributed to African
American Child Poverty? Pamela Oliver, Gary Sandefur, Jessica
Jakubowski, and James E. Yocom. Presented at the Population Association
of America, April 2, 2004. PDF
file
- "Racial disparities in imprisonment:
Some basic information" IRP Focus 21 (3) pp. 28-31
Spring 2001. IRP
dowload site (for other Focus articles)
- Click here for spreadsheets
showing many imprisonment trends by race and offense for 34 US states
1983-1999.
- Tables of State-Level Black and White Arrest and New Imprisonment
Rates and Disparity Ratios for 1996. Data spources are National Corrections
Reporting Program and Uniform Crime Reports for 37 states participating
in both programs. Acrobat PDF File.
Microsoft Excel spreadsheet file
- A graphical model of the relation
among poverty, politics, crime, and imprisonment Adobe Acrobat
file. It is important to remember that imprisonment does not directly
reflect crime, but also political decisions, and that imprisonment feeds
back into poverty and, thus, into the causes of crime.
- Computation table decomposing imprisonment into components due to
arrest and prison/arrest ratios. MS Word or WordPerfect or Adobe
Acrobat
- Research Proposal A scaled-down
version of this project has been awarded funding by the National Science
Foundation.
- Book in progress: Repressive
Injustice: Political and Social Processes in the Massive Incarceration
of African Americans, Pamela E. Oliver and James E. Yocom, Rose
Monograph Series.
- Prison and Jail Inmates at Midyear 2001,
Bureau of Justice Statistics. Wisconsin is #1 in black incarceration.
- American Society of Criminology
Draft of National Policy White Paper "The Use of Incarceration in the
United States" November 2000. National Policy Committee:
James Austin, Marino A. Bruce, Leo Carroll, Patricia L. McCall, Stephen
C. Richards. Comments are requested by the authors. Direct
comments to James Austin
- "Justice on Trial:
Racial Disparities in the American Criminal Justice System."
Leadership Conference on Civil Rights. A comprehensive review
of racial profiling, prosecution and sentencing disparities, with recommendations.
- Report on Minorities in the
Juvenile Justice System from the Office of Juvenile Justice and Delinquency
Prevention
- "And
Justice for Some" report on racial disparities in juvenile justice.
- PreventingCrime.org
"Preventing Crime: What Works, What Doesn't, What's Promising" published
by the National Institute of Justice, and other reports and links on
preventing crime, including why trying juveniles as adults may backfire,
and preventing gun violence. Reports available in brief and longer
versions. Easy-to-read summaries of research.
(Other Activism/Policy Links)
Top
Questions or Comments? Email Oliver -at- ssc -dot- wisc -dot- edu.
Last updated
June 5, 2012
© University of Wisconsin.
|