NOTE: I have moved new posts and pages about racial disparities over to my blog site, Race, Politics, Justice
US imprisonment rates are much higher than the rest of the world, and within the US, African Americans are imprisoned at least eight times as often as European Americans, while American Indians and Hispanics are imprisoned at two to three times the European American rate. (Asian American incarceration rates are generally lower than European American rates.) About a third of African American men are under the supervision of the criminal justice system, and about 12% of African American men in their 20s and 30s are incarcerated.

These astronomical incarceration rates have huge social and economic consequences for black women, black children, and black communities. They are not a legacy of Jim Crow, but are a result of policies implemented since the mid-1970s which created exponential growth in incarceration between 1975 and 2000. This growth was not due to growing crime rates, but to greater use of incarceration for lesser offenses and drug offenses. High incarceration rates ruin people’s lives and make the problem worse, by making it harder for young people who have done wrong to be rehabilitated, find jobs, and become productive members of society. Children whose parents are sent to prison are especially harmed by these policies.
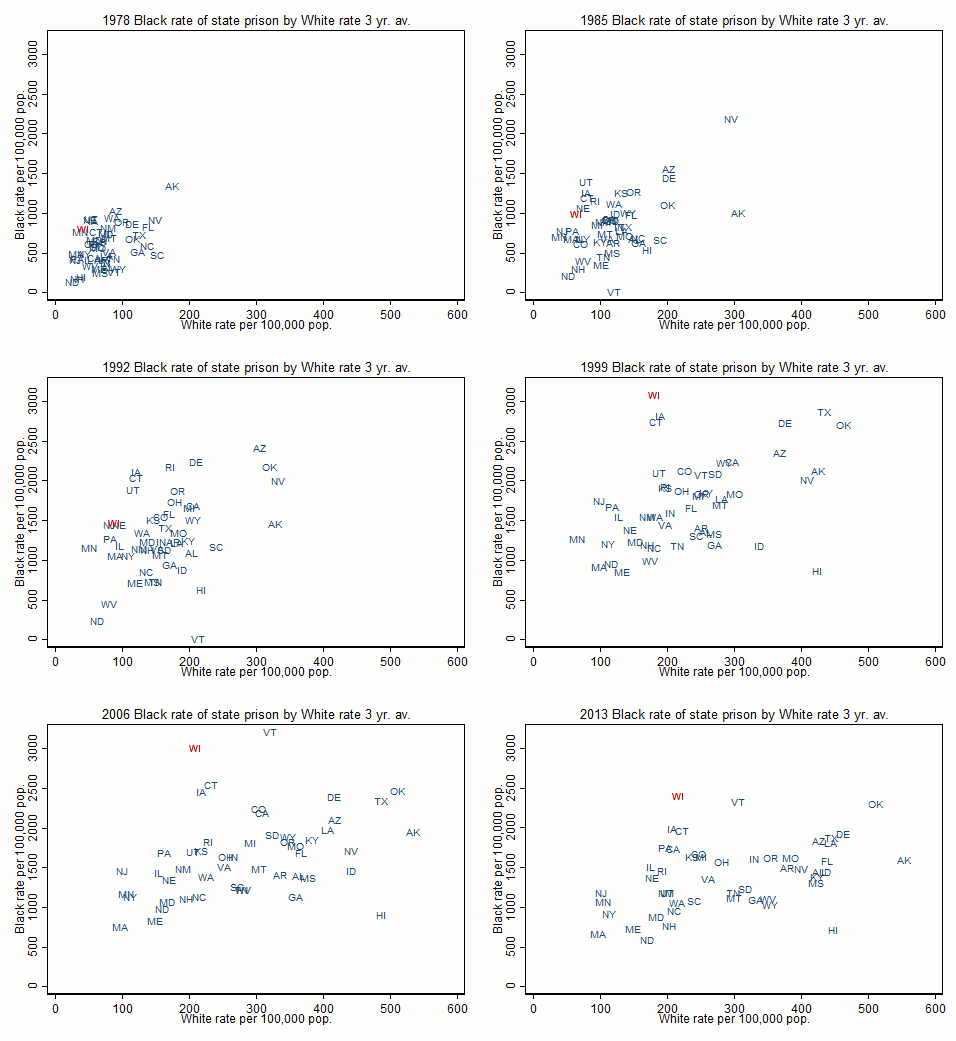
Wisconsin has an unusually high rate of Black imprisonment. As the animation shows, Wisconsin stayed at the top of the states even while its rate declined.

We have been doing a lot of analysis of the patterns of racial disparities in Wisconsin and the US as a whole. Reports, spreadsheets, and graphic displays are posted on this site for the purpose of providing information to the public. Copyright is held by the University of Wisconsin. Materials may be freely reproduced for use by the general public and nonprofit groups or educational institutions as long as credit is given to the author. This web site also includes links to reports, statistical resources, and advocacy groups.
This research has been funded by the University of Wisconsin’s Institute for Research on Poverty and the National Science Foundation grant SPS0136833. Any opinions, findings, and conclusions or recommendations expressed in this material are those of the author(s) and do not necessarily reflect the views of the National Science Foundation or the Institute for Research on Poverty.
The Project
We are using public data to compare imprisonment and arrest rates for different racial groups, separating these rates by type of crime. We have done some analyses comparing US states to each other, and have done a detailed county-level analysis of Wisconsin.
Major findings:
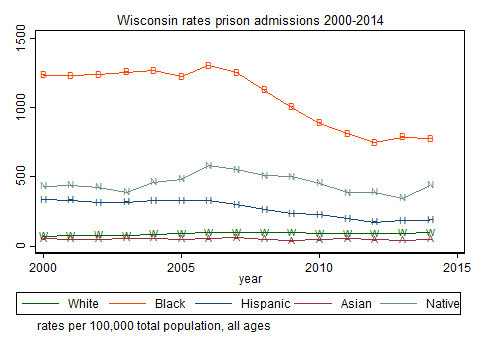
- Wisconsin has very high black prison admission rates which rose steadily through the 1990s, while Wisconsin’s white incarceration rates rose modestly.
- A major source of the rise is increased probation and parole revocations, which rose for both races but more rapidly for blacks.
- Whites are primarily sentenced to prison for violent offenses and white prison admissions for violent offenses grew in the 1990s, while drug sentences actually declined somewhat.
- By the late 1990s, most black new prison sentences were for drug offenses. Black sentences for drug offenses rose in the 1990s while sentences for serious crimes declined.
3 thoughts on “The Wisconsin Racial Disparities Project”
Comments are closed.