
The Excel file linked below shows characteristics of married and unmarried men and women aged 20-54 in 1940, 1960, 1980, 2000, and 2019, respectively. Measures included are employment status, personal wage and salary income (earnings), race/ethnicity, age, and education.
Farmers, those living in group quarters, and the self-employed were excluded from the sample because these are groups for which wage and salary income may not be applicable. Supplementary analyses (also included in the spreadsheet) show that including these groups and estimating trends with total personal income are similar. Individuals age 20-54 were included regardless of their spouses’ age given that a similar restriction is not possible for unmarried individuals.
Descriptive statistics are shown for four groups: married women, married men, unmarried women, and unmarried men. Married individuals are defined as those who were married (with or without a spouse present) as well as those who were separated. Unmarried individuals are defined as those who were divorced, widowed, or never married/single.
For each of the four groups, we show the proportion employed, unemployed, or not in the labor force, and the average total pre-tax wage and salary income (earnings). Earnings and income are adjusted to 2018 dollars (Consumer Price Index). Population shares of White, Black, and Hispanic are also calculated. Whites include those who identified as White regardless of ethnicity, Blacks include those who identified as Black regardless of ethnicity, and Hispanic include those who identified as Hispanic regardless of racial identification. The share of high school graduates, individuals with some college, and college graduates is calculated for each group. All descriptive statistics are calculated using person weights.
These tables were inspired by Lichter, Price, and Swigert (2020: Table 1), who provide similar descriptive statistics for 2008-2012 and 2013-2017 from the American Community Survey 5-year samples. Graphs of selected measures (% with a college degree, median earnings, % employed) are also linked below.
Lichter, Daniel T, Joseph P Price, and Jeffrey M Swigert. 2020. “Mismatches in the marriage market.” Journal of Marriage and Family 82(2):796-809.
Tables
![]() Characteristics of Married and Unmarried Men and Women Aged 25-54: 1940, 1960, 1980, 2000, 2019.
Characteristics of Married and Unmarried Men and Women Aged 25-54: 1940, 1960, 1980, 2000, 2019.
Figures
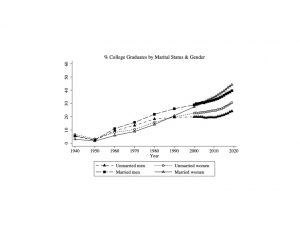 Characteristics of Married and Unmarried Men and Women Aged 25-54: 1940, 1960, 1980, 2000, 2019.