
Make an estimate about a population from a subset (sample) of the population.
When we conduct a survey we want to find out something about a population. And we want to do it efficiently cost-effectively.
So we sample elements (people) from that population, make measurements on the sample, and use the sample to generalize to the population.
We use random sampling procedures because we want to be able to estimate how precisely we can use the sample to make population estimates.
We try to design the sample so that we will be able
to make crucial estimates and comparisons with adequate precision, within
the limits of our financial resources.
List Samples
Simple random sampling
Stratification - Varying selection
probabilities
Population Samples
Telephone Samples
Problem with Telephone Directories
Random digit dialing - Telephone Surveys
List Assisted RDD Procedures
Estimation Precision/ Sampling Error
How large a sample do we
need?
Probably More than You Can
Afford
Weighting to reflect different selection probabilities
Response Rates and Non response
Non-response Bias
Do non-respondents Differ From
Respondents in Ways that will
affect what you are analyzing?
In this survey we wanted to be able to make comparisons between majority white and minority students, and we wanted to be able to make some comparisons among students in the different colleges. We divided the population into six mutually exclusive and exhaustive strata and selected within strata at different rates. (Within colleges we select seniors and non-seniors at approximately the same rate.
See first column of the table below.
When the data from the stratified sample are combined to make estimates
for the entire student body, the cases must be weighted by the inverse
of the selection rate. Cases in strata selected at high rates (e.g.,
minority students) are weighted less than those from those in strata selected
at low rates (L and S). When computing weights we also may adjust
for differential response among strata.
Proportion
Selection
Response
Completing
Rate
Rate
Interview
Minority
.2594
.8143
.2112
Letters and Science
Senior
.0286
.7549
.0216
Non-Senior
.0290
.8482
.0246
CALS, Education, Engineering
Senior
.0538
.8608
.0463
Non-Senior
.0511
.8473
.0433
Smallest Colleges
.1046
.8454
.0884
Total
.0541
.8352
.0452
Sampling Plan for a Health Survey of Wisconsin Population
The goal was to be able to make estimates of health for the black and
minority white populations for the rural and urban populations of the state.
We proposed dividing the telephone exchanges in the state into five strata,
and selecting approximately the same number of cases from each of the 5
strata. (Since there are no large concentrations of blacks in the "Rest
of State" stratum could not be divided.
|
|
Milwaukee County | Other Urban Counties | Rest of State |
| Areas of Concentration
of Black Popuation Other Areas |
Stratum 1
_______________________ Stratum 2 |
Stratum 3
_______________________ Stratum 4 |
Stratum 5 |
The response rate is the number of completed interviews as a percent
of the number of potential completed interviews - the number of cases eligible
to be interviewed.
Completed Interview
671
Non-Sample
Outside Rock County
17
Non-Residential
163
Non-Working/Disconnected
258
Total Non-Sample
544
Non-Response
Refusals
242
Language Barrier/Too Ill to
Interview/ Away for Duration
of Study
28
R Not Available/Other Non Response
225
Never Answered
40
Total Non Response
535
Total Sample
1750
A sample of 1460 students was drawn. Twenty-six students were in year abroad programs and were ineligible for interview. This left 1434 eligible students.
These cases resulted in:
1229 completed interviews
68 refusals
16 student abroad or gone for the duration (not in UW-Madison year-abroad program)
39 no telephone number was available (includes students
with no telephone and those for whom we
were unable to obtaintelephone number, some of whom were probably no longer
in Madison).
83 never reached, contacted but not completed, etc.
The response rate was 85.7%. This was figured by dividing the total number of completed interviews by the total number of eligible respondents:
Completed
Response Rate = ----------------------------------------------------------------
Completed + Refused + Gone + No # + Never reached etc.
1229
1229
= -------------------------------- = -------- = .857
1229 + 68 + 16 + 39 + 83
1434
As in previous student surveys rates of participation were quite high for all subgroups of students. Nonetheless there was some variation. This year freshmen had somewhat higher rates of completion than upper class students. Minority students had somewhat lower participation rates than majority white students, although differences were not great. The participation rate for Black students was 81 percent. Participation rates of men and women were virtually identical. In-state students had a considerably higher participation rate than out-of-state students (87 versus 82 percent). Completion rates are lower for students with relatively low SAT scores and relatively low GPA's. Seventy-nine percent of lowest SAT and GPA students completed interviews.

In longitudinal surveys we can examine differential non-response in relation to time 1 characteristics. This give us clues about possible non-response bias.
A national sample was interviewed in 1987-88; an attempt was made to re-interview all members of the sample in 1992-93; these are the percent successfully located and re-interviewed by characteristics measured at the first interview. Overall the reinterview rate was 82 percent.
Some groups have lower than average rates:
- minority group members
- persons who were interviewed in Spanish
- persons who were very old
- persons with less than a high school education
- persons whose health - physical or mental
- was poor
- persons living in metropolitan areas
- cohabitors
| TOTAL | 82 | |||||
| GENDER | AGE | |||||
| MEN | 80 | UNDER 25 | 78 | |||
| WOMEN | 83 | 25-34 | 82 | |||
|
RACE/ETHNICITY |
35-44 | 83 | ||||
| 45-54 | 86 | |||||
| BLACK | 77 | 55-64 | 84 | |||
| NON-HISPAN WHITE | 84 | 65-74 | 82 | |||
| MEX - AMER | 73 | 75+ | 67 | |||
| PUERTO RICAN | 68 | |||||
|
LANGUAGE |
LIFE SATISFACTION |
|||||
| ENGLISH | 82 | LOW | 78 | |||
| SPANISH | 61 | MEDIUM/HIGH | 82 | |||
|
EDUCATION |
HEALTH |
|||||
| >9 | 71 | EXCELLENT | 83 | |||
| 9-11 | 78 | VERY GOOD | 83 | |||
| 12 | 81 | GOOD | 79 | |||
| 13-15 | 85 | FAIR | 78 | |||
| 16+ | 89 | POOR | 76 | |||
|
MARITAL STATUS |
AREA |
|||||
| MARRIED | 83 | METROPOLITAN | 80 | |||
| SEPARATED | 80 | NON-METROPOLITAN | 86 | |||
| DIVORCED | 83 | |||||
| WIDOWED | 78 | REGION | ||||
| NEVER MARRIED | 79 | NORTHEAST | 80 | |||
| COHABITATING | 76 | MIDWEST | 86 | |||
| SOUTH | 81 | |||||
| WEST | 80 | |||||
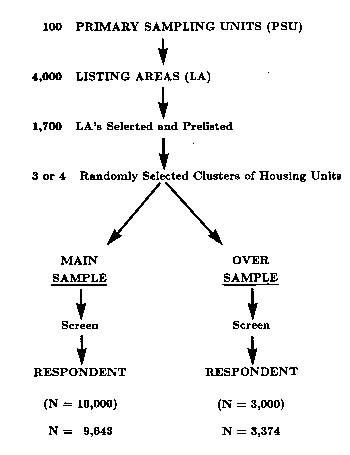
Primary sampling units are selected with a "probability proportional to size."
We did not discuss the oversample in class; households with the oversample
characteristics were selected into the sample at twice the rate of those
that did not have these characteristics. This involved screening
a large number of households to screen out those that did not have these
characteristics.
The map below shows the location of the primary sampling units.
These were individual counties or groups of counties.

- the larger the sample, the smaller the margin of error
- the more homogeneous the population with
respect to what you are estimating, the
smaller the margin of error
The following table shows the "margin of error" of estimates made from samples of different sizes and different levels of homogeneity. This table shows the 95 percent confidence level - 95 samples out of 100 would produce an estimate that falls within plus- or minus- the figure shown. For example, if the population proportion is 50 percent (the lowest possible homogeneity), a simple random sample of 1000 would produce an estimate between 47 percent and 53 percent 95 times out of 100. It would produce an estimate outside of this range 5 percent of the time.
The margin of error is a characteristic of a particular measure; not a characteristic of a poll.
| S A M P L E S I Z E |
|
|
|
|
|
|
|
|
|
|
|
|
|
|
|
|
|
|
|
|
|
|
|
|
|
|
|
|