Saving SAS Output Files
SAS makes it possible to save your statistical tables and graphs in many different formats, including
- HTML (web page) files,
- text (ASCII) files,
- PDF files,
- Word files,
and more. For graphics, there are also a variety of graphics file formats. See Understanding ODS destinations for more output options.
HTML (Default) Output
As you work in SAS or SAS Studio, the statistical tables and graphs output by your SAS procedures are displayed in the Results Viewer and stored in a temporary HTML file. This is good for day-to-day data exploration and code development.
proc means data=sashelp.class;
run;
However, there are several disadvantages to this format. Output files are not saved automatically. The HTML format produces each graph as a separate file, making it harder to save your output as a single file. And it has a default style called “HTMLBLUE”.
All of these problems are easily addressed through ODS commands written into your code.
Saving with ODS
You can automate saving your HTML output by redirecting your output to a file with an ODS HTML statement ("ODS" is an acronym for Output Delivery System). There are two basic options:
fileorbodypath
The file or body option specifies the name of the file to save. The path option specifies where to save that file.
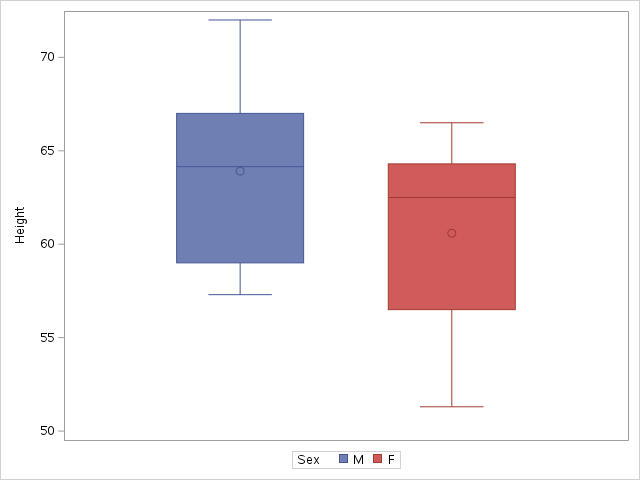
To save a PROC MEANS and a boxplot would be
ods html file="example.html" path="U:/";
proc means data=sashelp.class;
  class sex;
  var height;
run;

proc sgplot data=sashelp.class;
    vbox height / group=sex;
run;To stop writing to a file (a destination) you close it.
ods html close;Use the HTML5 destination to create a document that includes the graphics and text in a single file.
See the ODS HTML statement for numerous additional options.
Changing Style
HTML files (and some other output destinations) have shaded cells for the table headers, and a default color scheme for graphs. This is style. You can change the style.
ods html file="example-styled.html" style=journal;

proc means data=sashelp.class;
  class sex;
  var height;
run;

proc sgplot data=sashelp.class;
    vbox height / group=sex;
    run;
ods html close;See a gallery of SAS styles.
Text (Listing) Output
You may prefer plain text (“listing”) output. This is saved automatically when you run SAS in batch mode. We generally recommend batch mode if you want to save simple output.
Listing output is easy to share with colleagues, and is great for archiving a project as well.
Here, the file option includes any directory (rather than using path).
ods listing file="U:/example.lst";
/* optionally, use better form characters */
options formchar="|----|+|---+=|-/\<>*";

proc means data=sashelp.class;
run;

proc sgplot data=sashelp.class;
    vbox height / group=sex;
    run;
Use the options formchar statement to get output that is legible outside of SAS.
You can also switch to listing output when working interactively. Listing output will be sent to the Output window if you omit the file option. This can be noticeably faster than other forms of output, but cannot show you graphs.;
ods listing;
proc means data=sashelp.class;
run;
PDF and Word Output
Other output desinations work similarly. For PDF and MS Word documents, there is no gpath option because graphs are included in the primary file.
ods pdf file="U:/example.pdf"; /* Adobe PDF format */
ods word file="U:/example.docx"; /* MS-Word format */

proc means data=sashelp.class;
run;

proc sgplot data=sashelp.class;
    vbox height / group=sex;
    run;

ods word close; /* cannot be viewed until closed */
ods pdf close;Note you will not be able to look at intermediate results. You have to close these output destinations before you can view the files.
For additional options see ODS PDF statement or ODS RTF statement.
Multiple Destinations
SAS will happily write to multiple files simultaneously. If you check the Results pane when multiple destinations are "open", you will find that SAS added the PROC MEANs table to several files!
ods listing;
ods rtf file="u:\example.rtf"; /* MS-Word format */
ods pdf file="u:\example.pdf";
proc means data=sashelp.class;
run;

proc sgplot data=sashelp.class;
    vbox height / group=sex;
    run;
ods listing close;
ods rtf close;
ods pdf close;
Combining Listing and Log Output
When you are trying to debug a lengthy SAS command file, sometimes it is useful to have both the SAS code and the results it produces in one output stream (like in Stata or SPSS), so that you can see which output table (or which ERROR message) matches which specific PROC.
To do this, you must have listing output turned on, and redirect both your output and your log to a single file.
ods listing;
proc printto print="singlefile.txt" log="singlefile.txt";
run;
/* your SAS PROCs go here */
proc printto; /*Send your output and log back to their default windows*/
run;
Last Revised: 9/26/2024